Zillow Showcase
Getting Started Guide

Performance
Showcase Performance
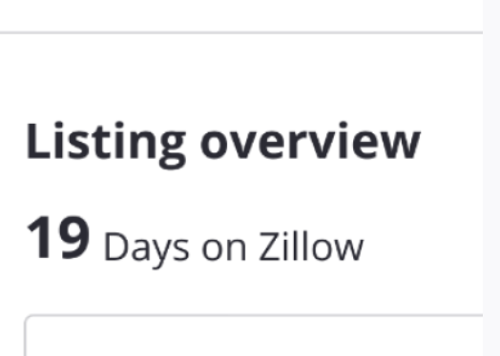
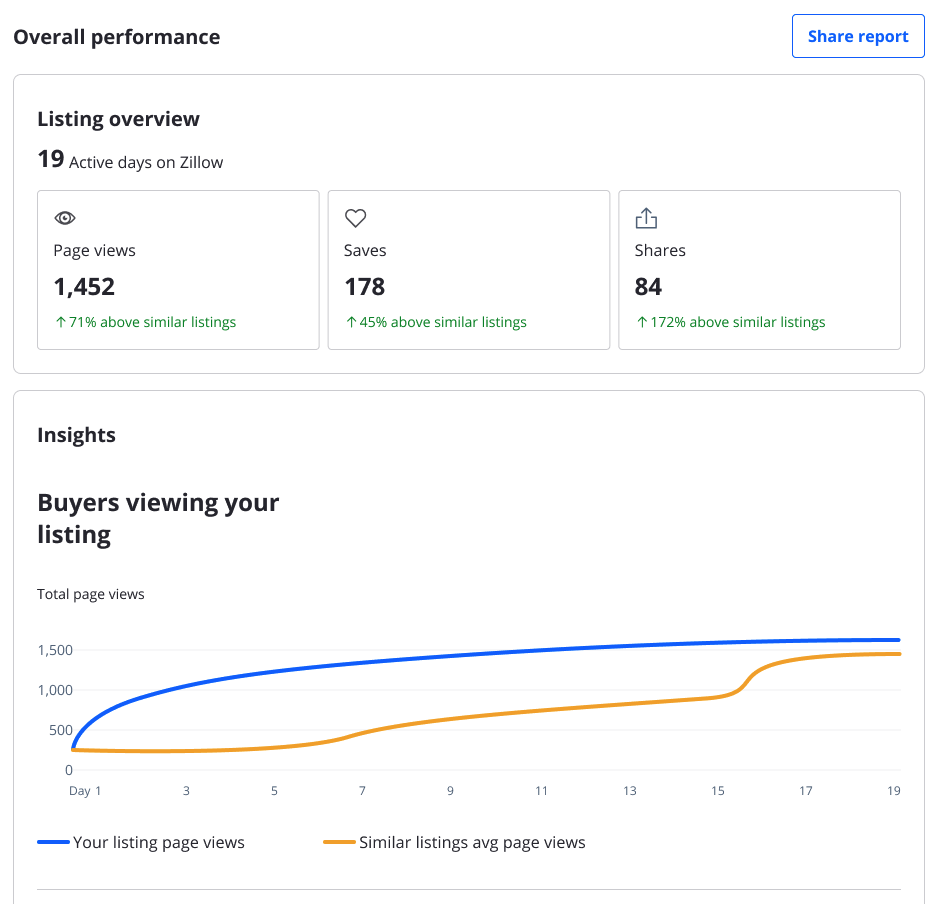
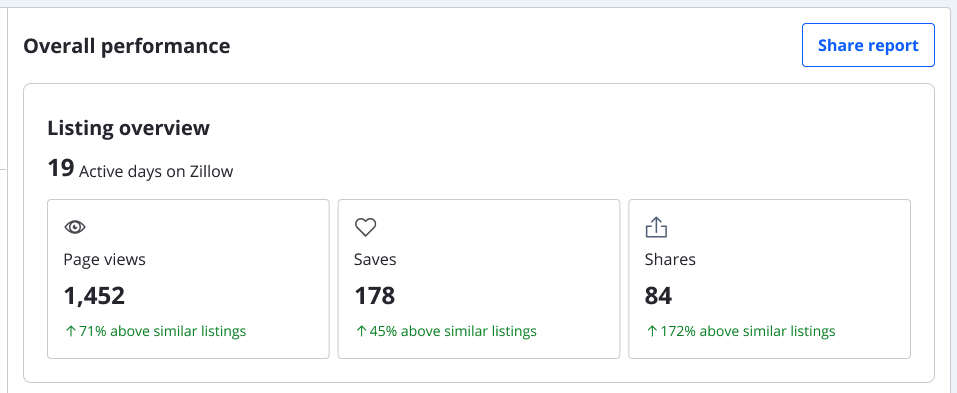
View your Showcase listing’s performance by clicking "Performance" on the left menu for each listing. This will give you insight into the page views, saves, shares and more for each individual Showcase listing, starting with the listing overview
"Days on Zillow" is the number of days a property has been listed for sale, up until it goes pending.
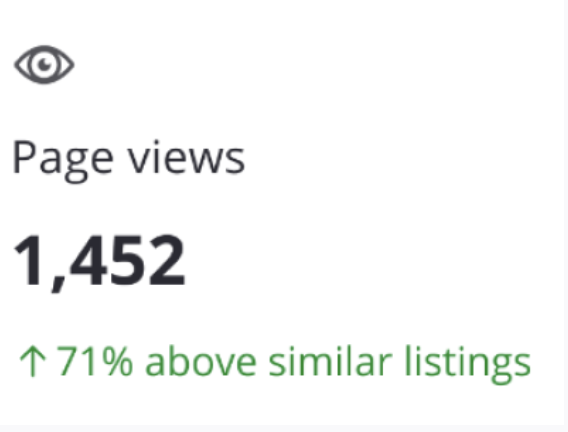
Total page views shows the total number of times your Showcase listing has been viewed since it went live, including repeat page views by the same unique user. It also shows the trend compared to similar listings.
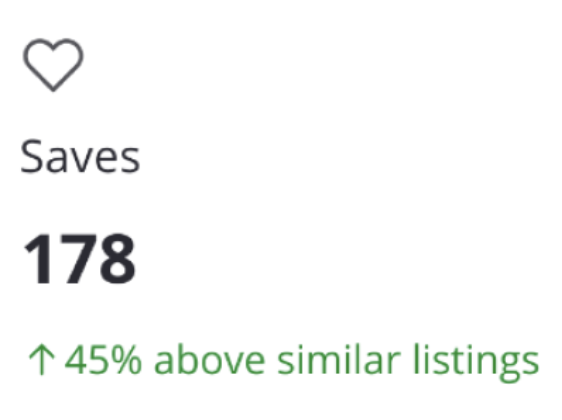
Total saves is the number of times users have saved your listing. The dashboard also displays a comparison to saves of similar non-Showcase listings.
Total shares will show you the total number of times users have shared your listing. The dashboard also displays a comparison to similar non-Showcase listings.
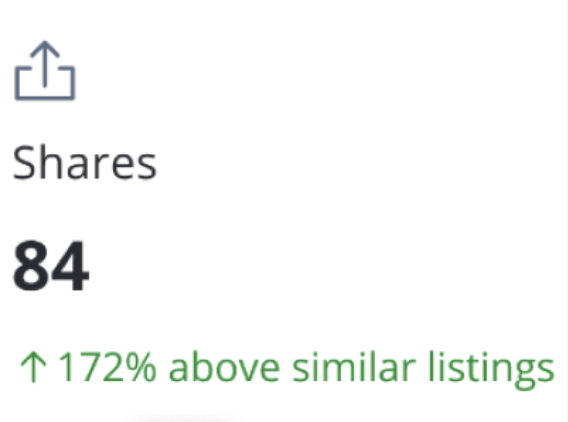
Please note that Showcase listing performance is compared with similar For Sale By Agent listings on Zillow that don’t use Showcase. This includes nearby homes with similar property type, price range and other search criteria.
Underneath the overview, you’ll see additional insights into your listing’s performance.
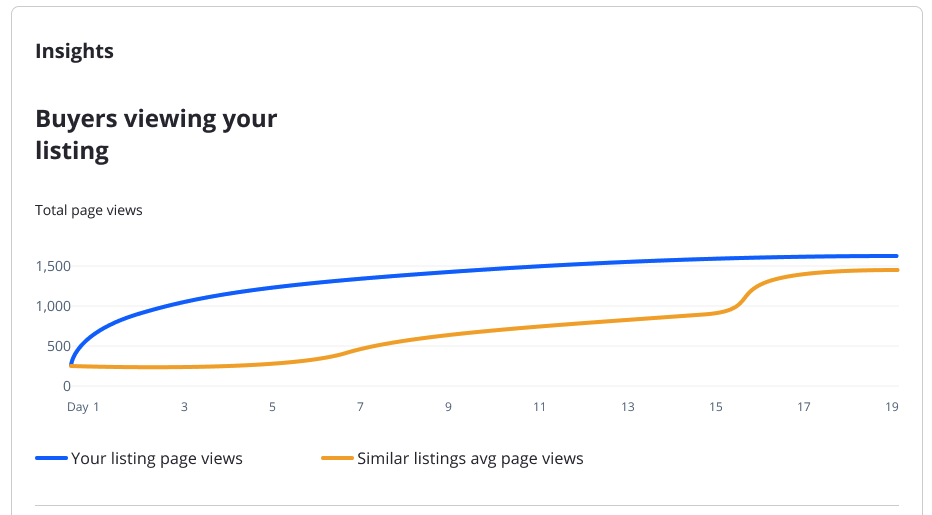
Here, you can also compare the performance of your Showcase listing vs similar non-Showcase listings. The “Buyers viewing your listing” graph displays the total number of page views since your Showcase listing went live on Zillow and compares it to the average daily number of page views on similar non-Showcase listings. This allows you to track the level of interest in the home over the life of the listing.
If the graph includes a green break, this indicates the period of time during which a listing was removed from the market.
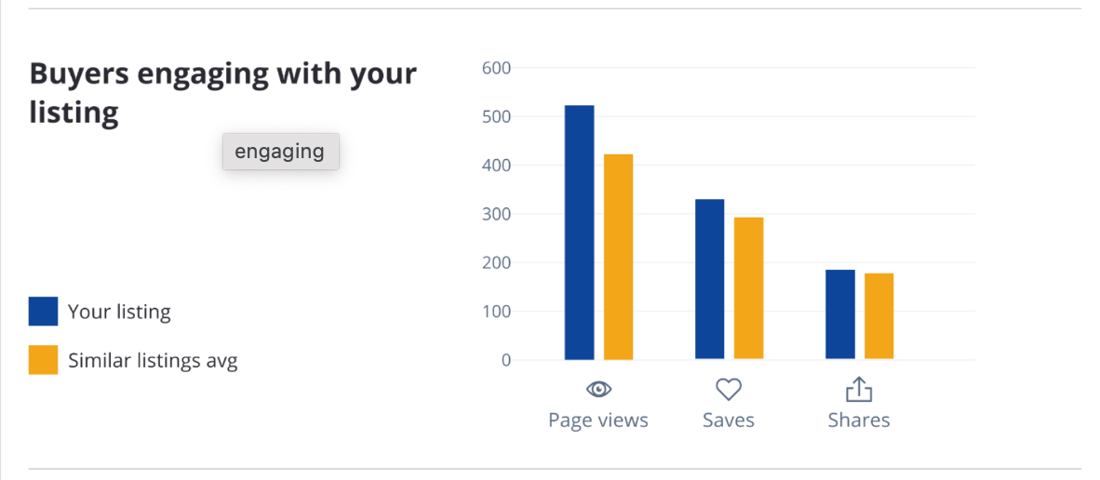
The “Buyers engaging with your listing” graph shows how your listing activity, including page views, saves, and shares compares to the average performance of similar listings. These metrics can be used to highlight the effectiveness of your Showcase listing in future listing presentations and other marketing.
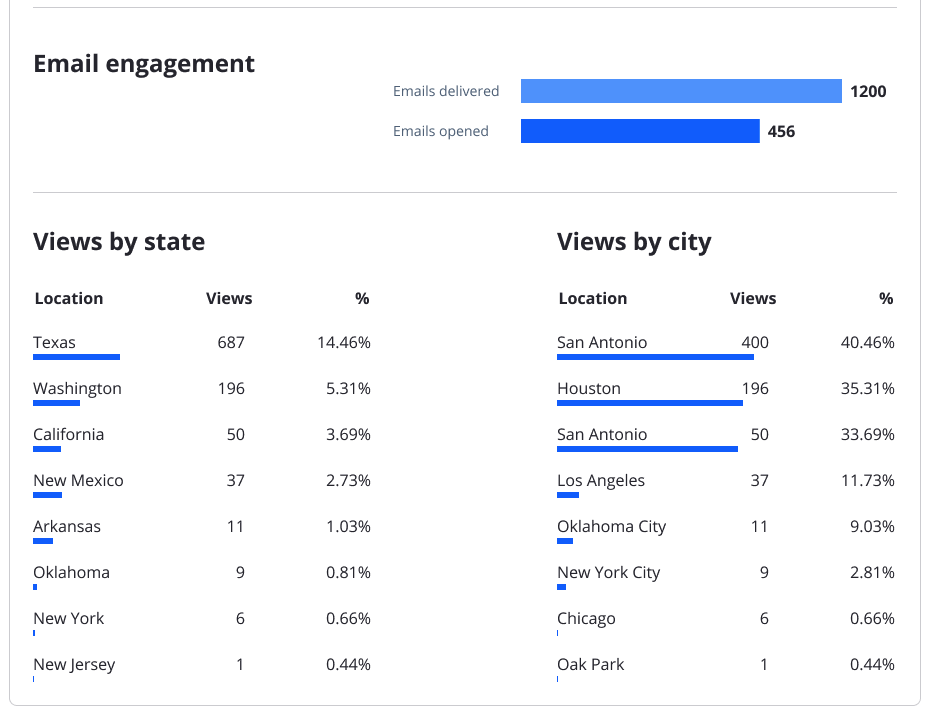
Use the “Email engagement” data to view the number of emails delivered, which shows how many potential buyers or sellers have received information about the listing. The number of emails opened reflects the total number of recipients who opened your email.
Please note that open rates are reported by third-party email processors and may vary.

You can see the views by state and city below email information. These charts break down buyer activity by location to help you understand local demand.
To export the listing performance data into a report that can be easily shared with your seller, click the “Share report” button at the upper right of the dashboard.
If you’re not seeing performance data, make sure your account is linked to your MLS. Linking your account to your MLS allows you to take ownership of the listing and see the data. Without that connection, no performance data will be available.
Please note that each user must link their own account to their MLS. This cannot be done by admins.
For more details on how to connect your Showcase account to your MLS, review the “My account” section within the “Getting started” section of this guide. If you’re having trouble making the connection, please contact our support team by reaching out via email at support@showingtimeplus.com.