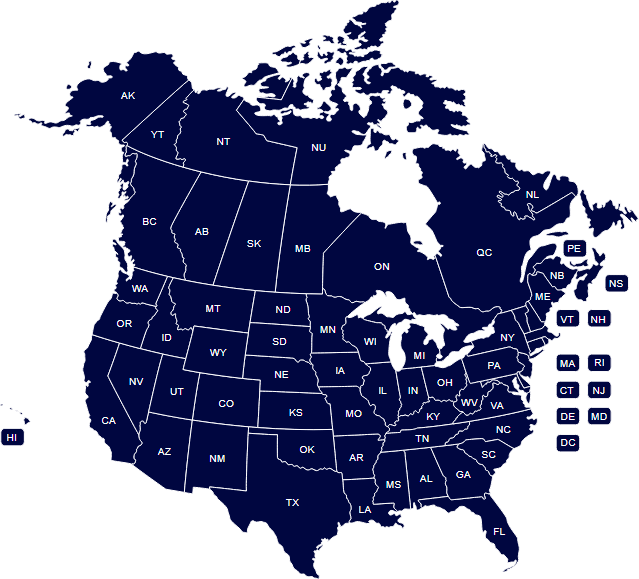
Daily Showing Activity Across the U.S. and Canada

The chart below tracks daily showing activity across North America and in individual states and provinces.

Daily Showing Activity Across the U.S. and Canada

AB BC MB NB NL NT NS NU ON PE QC SK YT AL AK AZ AR CA CO CT DE FL GA HI ID IL IN IA KS KY LA ME MD MA MI MN MS MO MT NE NV NH NJ NM NY NC ND OH OK OR PA RI SC SD TN TX UT VT VA WA WV WI WY DC

(click on a state or province to see the impact in your area)

Data Available Data Not Yet Available

Blue Map

The data points represent a rolling weekly average in ShowingTime’s 100 top markets, with each market recording tens of thousands of appointments in the years charted.

ShowingTime is the leading market stats and showing management technology provider to the residential real estate industry.